
Most teams are unknowingly fighting their compiler instead of working with it. V8 deoptimization traps, wrong toolchain choices, and missed configuration flags are silently killing app speed — often 50–200ms per interaction. Here’s the honest diagnosis, updated with everything that has changed in the past twelve months.
- TypeScript 6.0 section rewritten. TypeScript 6.0 shipped March 23, 2026 — the last JavaScript-based compiler release. Key breaking changes documented with migration notes.
- TypeScript 7 / tsgo preview updated. Beta available now as
@typescript/native-preview. Compatibility matrix from real-world testing added. - React Compiler 1.0 real production numbers. Updated with Wakelet’s exact INP figures, Sanity Studio component counts, and 18-month community retrospective findings.
- FAQ section added. 12 questions real developers are searching for, answered directly.
- Audit checklist expanded with TypeScript 6.0 migration checks and tsconfig targeting pitfalls.
- Problem: Your JS compiler setup is probably working against you. The most common culprits: still running Babel in a Next.js or Vite project, V8 hidden class fragmentation in hot code paths, and zero use of compiler diagnostics flags.
- Toolchain: SWC is 20–70× faster than Babel on multi-core builds. esbuild is 10–100× faster than Webpack + Babel. If you’re on a modern framework, you’re likely already using one — but misconfiguration is common.
- React Compiler 1.0 is stable since October 2025. Meta Quest Store saw >2.5× faster interactions. Sanity Studio reduced render time/latency 20–30% across 1,231 components. It does not fix architectural problems.
- TypeScript 6.0 (March 23, 2026) is the last JS-based tsc. If you have
"target": "es5"or"outFile"in your tsconfig, you need to act before upgrading. - TypeScript 7 (tsgo) is in preview now. VS Code type-checks 1.5M lines in 7.5s instead of 77.8s. Most linting/formatting tools break with it — use side-by-side installs until stable.
- Fix timeline: Profiling → toolchain audit → one targeted change → measure. This genuinely takes under an hour for the highest-impact improvements.
- Warning: The compiler optimizes the architecture you have. If the architecture is wrong, compiling faster does not help.
Why “Good Enough” Is Actually Failing You
There’s a category of technical debt that’s invisible until it catastrophically isn’t. Compiler configuration is exactly that. The build works. The app ships. Performance is fine — until one day your P99 latency is 200ms for a trivial operation, or your CI pipeline takes nine minutes when it used to take two, and nobody can explain the regression because it happened in increments over eighteen months of routine changes.
This is a structural problem, not a discipline problem. The JavaScript engine’s compilation pipeline is deeply counterintuitive, and toolchain choices made in 2021 often look reasonable on the surface while causing genuine damage underneath. The ecosystem also moves fast enough that what was the best choice three years ago may now be two generations behind.
Two things are true simultaneously: compiler-level optimizations are more impactful than most teams realize, and they’re also less magic than the benchmark marketing suggests. The 100× speedup number you see for esbuild vs Webpack with Babel is real — but it’s measured on a cold build on a large project. If your total build is twelve seconds, a 10× improvement saves eleven seconds. Worth having, not worth panicking about if you don’t have it yet. The V8 deoptimization problems, on the other hand, can produce hundred-fold latency increases on production traffic, which is an entirely different category of urgency.
Let’s look at what’s actually going wrong, starting at the engine level.
The V8 Deoptimization Traps No One Tells You About
To diagnose compiler failures, you need a rough mental model of how V8 actually works. The version running in Node.js 22 and Chrome 120+ is meaningfully different from five years ago, and the differences matter.
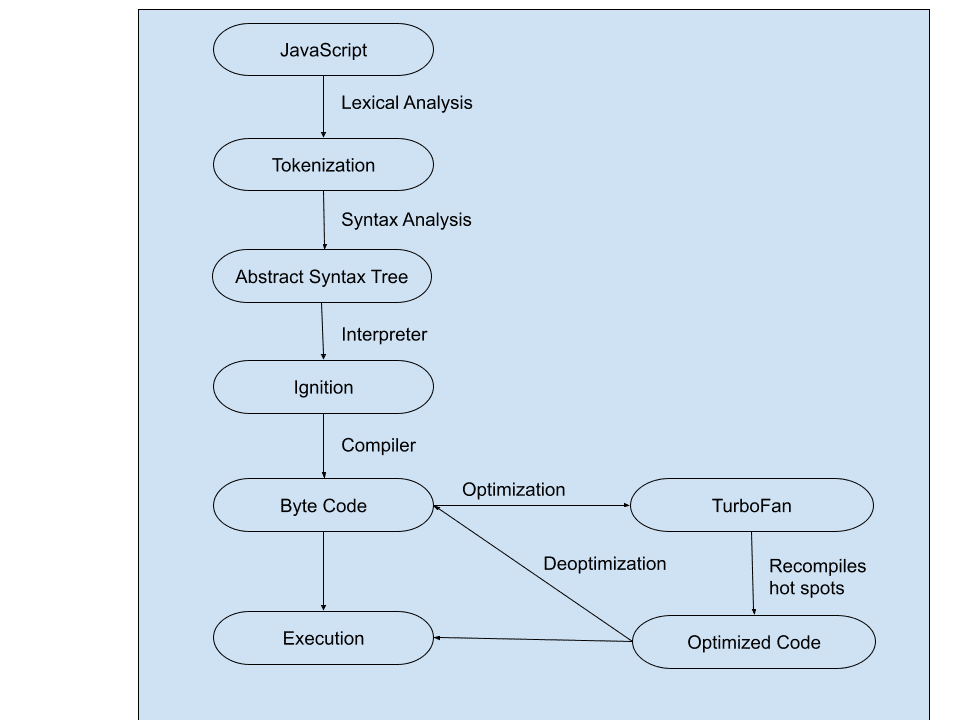
V8 today uses a four-tier compilation pipeline. Code starts in Ignition (the bytecode interpreter), moves to Sparkplug (fast baseline machine code, compiled without optimization), then to Maglev (mid-tier optimizing compiler, enabled by default in Node.js 22+), and finally to TurboFan for the hottest code paths. The backend of TurboFan is being progressively replaced by Turboshaft, a CFG-based intermediate representation that compiles roughly twice as fast as the old Sea of Nodes approach. Since Chrome 120, all CPU-agnostic backend phases use Turboshaft.
The practical consequence: V8 is more aggressive about optimization than ever, which means the penalties for breaking its assumptions are also more dramatic.
Hidden classes and the shape consistency problem
V8 assigns every JavaScript object an internal “hidden class” (also called a shape or map) describing its memory layout. When objects with the same shape pass through the same function, V8 can use fast offset-based property access instead of dictionary lookups. The catch: a shape is determined by which properties exist and the order in which they were added. Add a property conditionally, or add properties in different orders across code paths, and you create distinct hidden classes.
Adding properties to objects conditionally, or in different initialization orders across code paths, creates distinct hidden classes and forces V8 into slower polymorphic or megamorphic access patterns. In functions called thousands of times per second, this is directly measurable as latency.
// Creates THREE distinct hidden classes — looks harmless, isn'tfunction createUser(data) { const user = { id: data.id, name: data.name }; if (data.isAdmin) user.role = 'admin'; // conditional add = new shape return user;}// user1 → { id, name } Shape A// user2 → { id, name, role } Shape B ← hot function hits two shapes = polymorphic IC// ✅ Fix: initialize all properties upfront, even as nullfunction createUser(data) { return { id: data.id, name: data.name, role: data.isAdmin ? 'admin' : null, // same shape every time };}JavaScriptThe three inline cache states — and why megamorphic kills you
V8 classifies property accesses into three states: monomorphic (one hidden class — fastest), polymorphic (2–4 classes — tolerable), and megamorphic (5+ classes — V8 gives up and falls back to a global stub). Functions in megamorphic state cannot be meaningfully optimized by TurboFan. If you have a utility function that processes many differently-shaped objects — a generic logger, a data transform function, a mapper — there’s a real chance it’s operating in megamorphic territory without any signal that this is happening.
Type instability and TurboFan deoptimization
TurboFan makes speculative assumptions based on observed types. If a function has consistently received integers and suddenly receives a float, V8 deoptimizes — it discards the compiled machine code and falls back to the interpreter. The function gets recompiled after the next few calls, but the transitions themselves cost time, and in production traffic patterns they can happen repeatedly.
// Type instability — avoid in hot pathsfunction process(value) { return value * 2;}process(10); // integer — V8 specializes for intprocess(10.5); // float — different SMI representation, triggers recompileprocess("10"); // string — full deoptimization// Diagnostic: find yo-yo functions with// node --trace-opt --trace-deopt your-script.js// Look for functions that appear in both logs (optimize → deoptimize → optimize again)Node.js diagnosticRun node --trace-opt --trace-deopt your-script.js. Functions that appear in both logs — optimized then deoptimized, then optimized again — are “yo-yo” functions. In Chrome DevTools, the Performance tab’s flame graph marks deoptimized frames. Both tools work on production builds if you can reproduce the traffic pattern locally.
The delete operator is quietly wrecking your perf
Using delete obj.prop changes the object’s hidden class every single time. V8 creates a new shape to represent the now-missing property, which breaks inline cache hits for any subsequent function that touches that object. The simple fix is setting the property to null or undefined instead, which preserves the shape. This sounds pedantic until you find it in a hot serialization loop.
Toolchain Comparison: Babel, SWC, esbuild, Oxc, and Bun
The build-time side of the compiler strategy problem is more immediately actionable than the V8 side, because the benchmarks are public, the migration paths are well-documented, and the gains are substantial and verifiable.
The ecosystem has made a sharp turn. Systems-language tools — Rust (SWC, Oxc, Biome), Go (esbuild, TypeScript 7), and Zig (Bun) — have made JavaScript-based build tools look like a previous era for raw throughput work.
Where each tool actually fits
| Tool | Language | Role | Speed vs Babel | Best for |
|---|---|---|---|---|
| Babel | JavaScript | Transpiler | Baseline (1×) | Legacy projects, exotic plugin transforms, Babel macros |
| SWC | Rust | Transpiler + minifier | 20–70× faster | TypeScript-heavy projects, Next.js, Parcel, Deno |
| esbuild | Go | Bundler + transpiler | 10–100× faster | Vite dev, libraries, instant HMR, CI pipelines |
| Bun | Zig | Runtime + bundler | SWC-comparable | All-in-one replacement for Node + npm + build step |
| tsc 5.x / 6.0 | TypeScript | Type checker + emitter | 3–9× slower than esbuild | Type checking; separate from emit for best performance |
| Oxc | Rust | Parser + linter + transformer | 3× faster parser than SWC | Large codebases; Shopify: 75-min lint → 10s with oxlint |
| tsgo (TS 7 preview) | Go | Type checker | ~10× faster than tsc | Type-check only today (emit pipeline still in progress) |
Sources: BetterStack: ESBuild vs SWC · privatenumber/minification-benchmarks (updated April 2026) · AppSignal: Performance Revolution in JS Tooling
Build speed benchmarks — what the numbers actually mean
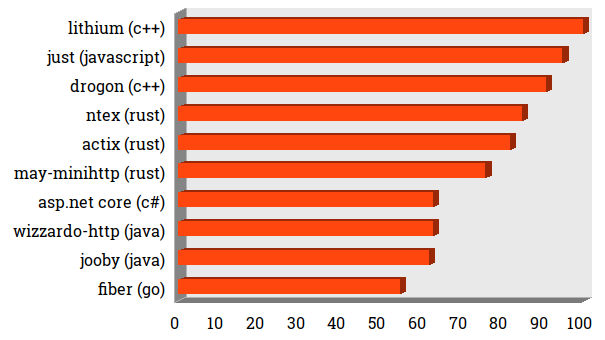
Bars represent relative build time (shorter = faster). Benchmarks vary significantly by codebase size, module count, and hardware. These are representative, not universal.
On a build that already takes 8 seconds, a 10× speedup saves 7.2 seconds — real, but not a crisis if you don’t have it today. The gains become genuinely transformative in: CI pipelines with 4–10 minute builds, large monorepos where parallelism matters, and cold-start dev servers where human perception is the constraint. For smaller projects, get the easy wins (correct target, no redundant Babel) and move on.
Why teams stay on Babel
Babel’s plugin ecosystem is genuinely unmatched for certain use cases: experimental syntax proposals, highly customized AST manipulations, Babel macros, and complex code transforms that rely on Babel’s mature plugin API. SWC’s plugin ecosystem, while improving fast, still trails Babel in advanced transformations. The honest threshold: if you use fewer than three Babel plugins and none of them are custom or exotic, you can probably migrate to SWC or esbuild today. If you’re deeply invested in custom Babel plugins, budget time for porting them — it’s not free.
Vite and Next.js — you may already be there
If you’re using Vite, you’re already on esbuild for dev and Rollup for production builds (with Rolldown in active development as a faster Rollup replacement). If you’re on Next.js 13+, you’re already using SWC for transpilation and Turbopack became stable for production in January 2026. Both are good positions. The question is whether you’ve misconfigured something on top of them — a Babel plugin layer added for one feature, an outdated target in your config, source maps accidentally enabled in production.
React Compiler 1.0 — 18 Months of Production Data
React Compiler 1.0 shipped on October 7, 2025. It’s not experimental, not a beta. It’s production-stable, and it’s been running in Meta’s apps long enough to have genuine longitudinal data. With eighteen months since the beta and about seven months since stable, we now have a clearer picture of where it helps, where it doesn’t, and where the community has landed on it.
The pitch: instead of manually managing useMemo, useCallback, and React.memo, the compiler analyzes your component’s data flow at build time and inserts memoization where it’s actually needed. The React team’s internal estimate was that 60–70% of performance issues in their own apps stemmed from missing or incorrect memoization. That sounds dramatic but becomes plausible when you think about how often dependency arrays drift from what they should be.
Production numbers — the honest version
Meta (Quest Store): Up to 12% faster initial loads and more than 2.5× faster interactions, without increasing memory usage. The Quest Store is a large, complex React app — these numbers come from real traffic, not synthetic benchmarks.
Sanity Studio: After precompiling their packages with React Compiler, 1,231 of 1,411 components were compiled, resulting in a 20–30% overall reduction in render time and latency. The 180 remaining components needed refactoring to support auto-memoization — mostly those with imperative patterns or direct DOM references. Their approach — precompiling packages rather than enabling globally — let them validate component-by-component.
Wakelet: After rolling the compiler to 100% of users, overall LCP improved 10% (2.6s → 2.4s) and INP improved approximately 15% (275ms → 240ms). These are Core Web Vitals improvements with direct business implications.
Independent testing (Nadia Makarevich, ~15,000-line production codebase): Lighthouse scores were virtually identical on initial load. A theme toggle interaction dropped total blocking time from 280ms to zero. A checkbox filter dropped from 130ms to 90ms but didn’t fully eliminate re-renders due to non-memoized object references from an external library. This is the most useful independent data point — it’s honest about the architectural limits.
What the compiler can’t do
React Compiler intentionally skips code that depends on useRef, because its mutable, non-reactive nature makes safe memoization impossible to guarantee. It also silently skips code it can’t statically analyze — and it doesn’t always surface this clearly. The eighteen months of community adoption have clarified what the compiler is and isn’t: it’s a very effective reducer of manual memoization overhead, not a general-purpose performance solution.
Upgrade eslint-plugin-react-hooks to the recommended-latest preset first — this ships compiler-powered lint rules that surface Rules of React violations. The compiler assumes your code follows the Rules. Fix the lint violations before enabling the compiler, not after. React DevTools v5+ shows “Compiler” badges on optimized components, which is the fastest way to verify the compiler is actually running on your key components.
Setup in under 10 minutes
# Installnpm install --save-dev --save-exact babel-plugin-react-compiler@latest# next.config.js (Next.js 15+)const nextConfig = { experimental: { reactCompiler: true, },};# vite.config.jsimport { defineConfig } from 'vite'import react from '@vitejs/plugin-react'export default defineConfig({ plugins: [ react({ babel: { plugins: ['babel-plugin-react-compiler'], }, }), ],})# React 17/18 projects — add runtime shimnpm install react-compiler-runtime# Then add target: 17 or target: 18 in compiler configJS ConfigTypeScript 6.0: The Deprecation Apocalypse You Need to Survive
TypeScript 6.0 shipped March 23, 2026. This is the last version of the TypeScript compiler written in JavaScript. Everything after it runs on a new compiler written in Go (TypeScript 7.0). TypeScript 6.0 is a bridge release — its job is to introduce deprecation warnings for everything that TypeScript 7.0 will remove, giving teams a clean migration runway.
TypeScript 6.0 carries the largest set of breaking changes since TypeScript 2.0. Here’s what affects real projects:
Removed: ES5 as a compilation target
"target": "es5" is gone. ES5 support was added when TypeScript was positioning itself as the language that compiled to Internet Explorer-compatible JavaScript. That world does not exist in 2026. Every relevant runtime environment is evergreen. Projects that haven’t revisited their tsconfig since 2018 may have surprises waiting. If you genuinely need ES5 output for a legacy deployment target, use Babel or SWC as a post-processing step — not tsc.
Removed: --outFile and module concatenation
"outFile" concatenated all TypeScript output into a single JavaScript file — a feature primarily useful with AMD and SystemJS modules, both of which are also being deprecated. If you need bundling, use a bundler.
New default: strict: true
Strict mode is now on by default. If your project wasn’t using it, upgrading will surface type errors you didn’t know you had. This is a good thing, but it requires time to address. Add "strict": false explicitly if you need to defer this work.
Migration strategy
The simplest path: upgrade to TypeScript 6.0, fix every deprecation warning the compiler surfaces, then test with tsgo --noEmit (the TypeScript 7 preview) as a parallel check. If both report the same errors, you’re ready for 7.0 when it reaches stable.
TypeScript 7 / tsgo: What’s Actually Usable Today
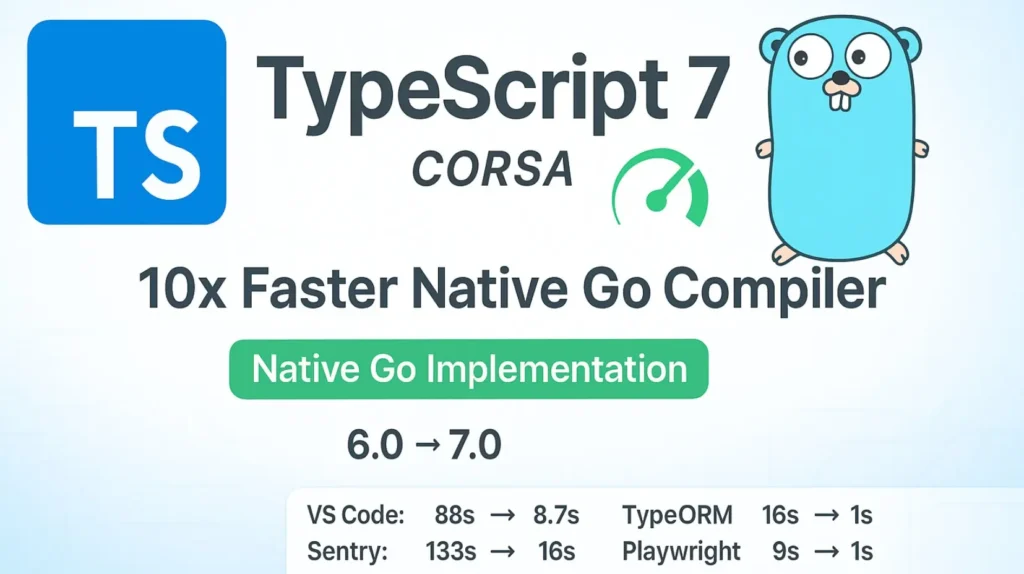
The TypeScript 7 preview — available now as @typescript/native-preview — is far enough along to run on real projects. The headline number is real: VS Code’s 1.5 million line codebase checks in 7.5 seconds vs 77.8 seconds with current tsc. The Sentry codebase goes from 133 seconds to 16 seconds. These are not toy benchmarks.
The honest picture from teams who’ve tested it in 2026: tsgo --noEmit works well for type-checking. The emit pipeline (actually generating JavaScript from TypeScript) is still in progress. More critically, nine of fifteen common pipeline tools break when tsgo becomes your primary TypeScript installation, because they depend on the existing Strada API that Corsa doesn’t support yet.
- March 2025Project Corsa announcedGo-based rewrite of tsc, type-checker, and language server announced by Anders Hejlsberg. GitHub repo opened for public development.
- December 2025Progress update — high compatibility confirmedTypeScript team ran 20,000 compiler test cases; only 74 show any difference between tsgo and tsc. All known issues, not silent divergence. Many teams reported using Corsa for type-checking without blocking issues.
- March 23, 2026TypeScript 6.0 shippedLast JavaScript-based TypeScript. Strict mode on by default. ES5 target removed. No TypeScript 6.1 planned — all engineering effort moves to the Go port.
- May 2026 (current)tsgo available as
@typescript/native-previewUsenpx tsgo --noEmitfor fast type-checking. Most linting/formatting tools need side-by-side install with TypeScript 6.0 for Strada API compatibility. - Mid-to-late 2026 (expected)TypeScript 7.0 stabletsgo becomes tsc. Full feature parity with TypeScript 5.8 as baseline. Emit pipeline complete. Teams with TypeScript 6.0 compatibility should require only a version bump.
What to do today
The zero-risk test:
# Install side-by-side (won't replace your existing tsc)npm install -D @typescript/native-preview# Run type-check with the new compilernpx tsgo --noEmit# Compare output to current tscnpx tsc --noEmit# If both agree (or tsgo finds nothing new), you're in good shape# Use tsgo --noEmit in CI for a parallel fast type-check stepTerminalKeep typescript in your devDependencies pointing to version 6.x for your linters, formatters, and IDE integrations. Add @typescript/native-preview as a separate devDependency for a parallel CI type-check step with tsgo --noEmit. You get the speed benefit today without breaking your toolchain. When TypeScript 7.0 ships stable and the ecosystem catches up, swap them.
Also: Node.js 22.18+ supports running TypeScript files directly via built-in type-stripping. For scripts and services where type-checking can be a separate CI step, this removes the tsc dependency from your hot path entirely.
The 60-Minute Fix: A Step-by-Step Action Plan
The diagnostic work is harder than the actual fixes. Once you know what’s wrong, most of these changes are configuration, not rewrites. Here’s the sequence that works.
-
Profile before touching anything (10 minutes)
Run
node --prof your-script.jsand process withnode --prof-process. In Chrome DevTools Performance tab, record a real interaction and look for “deoptimize” markers. Time your CI build step explicitly. You need baseline numbers before any change — without them, you can’t tell if a change helped or made things worse. -
Audit your build toolchain (5 minutes)
Run
npm ls @babel/core --depth 0. If it’s in your tree and you’re on Next.js 13+, Vite 4+, or modern Parcel, you may be double-compiling code — Babel running alongside SWC or esbuild. Also check yourtsconfig.jsontarget. If it says"es5"and you support modern browsers, you’re compiling unnecessary polyfills on every build. -
Migrate from Babel to SWC or esbuild (10–20 minutes)
For Next.js: remove any custom
.babelrcorbabel.config.jsand verifyswcMinify: trueis set (default in Next.js 13+). For standalone builds:npm install --save-dev @swc/core @swc/cliwith a minimal.swcrc. For Vite: verify you’re not layering Babel transforms on top of esbuild without a specific reason. -
Separate type-checking from emit (5 minutes)
If tsc is doing both in sequence, split them:
tsc --noEmitfor type checking (in CI in parallel) and SWC or esbuild for emit. Addnpx tsgo --noEmitas a second parallel check to get a feel for your TypeScript 7 readiness. Your editor stays fast; your type errors are caught; your build doesn’t wait for the slowest part of tsc. -
Fix the three most common hidden class violations (10 minutes)
Codebase-wide search for: (1) objects with conditionally added properties — fix by initializing all properties upfront as null; (2) use of
delete obj.prop— replace withobj.prop = null; (3) functions that receive objects of different shapes — normalize at the call site. These are fast to find and fast to fix once you know what you’re looking for. -
Enable React Compiler if on React 17+ (5–10 minutes)
Install
babel-plugin-react-compiler@latest, enable via your framework config, run your test suite. If tests pass, ship it. Open React DevTools and confirm “Compiler” badges appear on your key components. If a component isn’t being compiled, look foruseRefpatterns or Rules of React violations. Don’t enable it until the eslint-plugin-react-hooksrecommended-latestpreset is clean. -
Update your TypeScript target (5 minutes)
If your tsconfig has
"target": "es5"and you support only modern browsers, change it to"es2020"or higher. TypeScript 6.0 removed ES5 as a target entirely. Compiling to a modern target produces smaller output, faster builds, and lets V8 use native features instead of polyfilled implementations.
Audit Checklist Before You Touch Anything
This takes 10 minutes and tells you exactly where to focus. Work through it top to bottom before making any changes.
- Is Babel in your production build pipeline? (
npm ls @babel/core --depth 0) - Is your framework (Next.js, Vite, Parcel) already using SWC or esbuild internally?
- Are you running tsc for both emit AND type-checking in the same sequential step?
- Is your
tsconfig.jsontarget set to"es5"? (Remove in TS 6.0+, or add ES5 via Babel as a post-step) - Does your tsconfig still have
"outFile"? (Removed in TypeScript 6.0) - Have you run
--trace-opt --trace-deoptprofiling in the last 6 months? - Are there objects in hot code paths with conditionally added properties?
- Is
deleteused anywhere on objects in hot code paths? - Do any high-frequency functions receive objects of varying shapes?
- If using React: have you enabled
eslint-plugin-react-hookswithrecommended-latest? - Is your minifier outputting source maps in production? (It shouldn’t be)
- Is tree-shaking actually verified as working? (Check bundle analyzer output, not just the build log)
- Have you run
npx tsgo --noEmitto test TypeScript 7 compatibility? - Does your build pipeline run type-checking and emit in parallel, or sequentially?
- If on Next.js Turbopack: did it become stable for production in January 2026 — are you using it?
Real-World Cases Worth Knowing
Raw benchmarks are useful for directional understanding. The scenarios where compiler strategy actually broke something real tend to be more instructive about what to watch for.
The config object latency spike
A Node.js API endpoint processing configuration objects saw latency go from 2–5ms to over 200ms — a hundred-fold increase — after a routine refactor. The cause: the refactor changed the order in which properties were assigned to config objects in one specific code path. TurboFan had optimized the function assuming uniform object shapes; with mixed shapes appearing (different hidden classes for the same conceptual object), the function deoptimized. The fix was initializing all config properties in a consistent order across all code paths. Total change: about 15 lines. The takeaway: shape consistency matters in proportion to how hot the code path is.
Shopify and the linting time cliff
Shopify’s linting setup took 75 minutes fanned across 40+ CI workers before switching to oxlint (part of the Oxc Rust toolchain). After the switch: approximately 10 seconds on a single worker. That’s not a small improvement — it fundamentally changed how Shopify’s engineers could reason about their CI pipeline and what feedback cycles were possible. They also surfaced bugs during the migration that the previous setup had been skipping. This is the clearest available example of what the Rust toolchain generation actually delivers at scale.
Sanity Studio’s React Compiler rollout
Sanity Studio’s approach was methodical: they precompiled packages rather than enabling the compiler globally, validating component-by-component. After compiling 1,231 of 1,411 components, they measured 20–30% reduction in render time and latency. The 180 remaining components were those that needed refactoring — mostly imperative patterns and direct DOM references. The lesson: methodical adoption with per-package validation is safer than enabling it globally and hoping for the best.
VS Code and TypeScript 7
1.5 million lines of TypeScript across 47 packages. Type-check time: 77.8 seconds with current tsc, 7.5 seconds with tsgo. This is one of the largest TypeScript codebases in production, which is exactly why Microsoft used it as the benchmark. The numbers are confirmed by multiple independent teams who’ve tested the preview. The 10× figure isn’t marketing — it’s what you get on a real, large codebase, not a toy project.
Sentry: 133s → 16s
Sentry’s TypeScript codebase, tested against the tsgo preview, went from 133 seconds to 16 seconds for a full type-check — a 10.2× improvement. Both the VS Code and Sentry numbers are confirmed by early adopters. Sentry’s is particularly useful because it’s a different type of large codebase — a developer tool with complex type relationships, not a monorepo of largely independent packages like VS Code.
FAQ
Should I still use Babel in 2026?
Only if you have a specific reason to: custom Babel plugins, exotic syntax transforms, or a codebase with deep Babel configuration that would take significant effort to migrate. For standard TypeScript or JavaScript compilation, SWC or esbuild are strictly faster with no functional downside. If your only Babel plugins are @babel/preset-env and @babel/preset-typescript, migrate today — the payoff is immediate and the risk is low.
Is React Compiler 1.0 safe to enable in production?
Yes, as of October 2025. It’s been battle-tested at Meta scale and has a clear adoption path. The recommended approach: enable it behind a flag, run your full test suite, use React DevTools to verify key components are being compiled, and check for useRef patterns that the compiler intentionally skips. For existing apps, precompiling packages individually (as Sanity Studio did) is more controlled than a global enable.
Can I start using TypeScript 7 / tsgo today?
Yes, but for type-checking only. Install @typescript/native-preview alongside your existing TypeScript 6.0, and use npx tsgo --noEmit as a parallel CI step. Don’t replace typescript in your devDependencies yet — nine of the fifteen most common TypeScript pipeline tools break when tsgo is the primary install, due to the in-progress Corsa API replacing the existing Strada API.
Will TypeScript 7.0 break my existing tsconfig?
If you’ve upgraded to TypeScript 6.0 and addressed all deprecation warnings, the migration to TypeScript 7 should be mostly a version bump. TypeScript 6.0 was specifically designed to surface everything that would break in 7.0. Projects that have "target": "es5", "outFile", or that rely on the Strada API will need changes, but the deprecation warnings in 6.0 identify these explicitly.
What’s the difference between SWC and esbuild? Which should I use?
SWC is a transpiler and minifier with TypeScript support and a growing plugin ecosystem — the right choice for TypeScript-heavy projects and anywhere that integrates deeply with Next.js or Deno. esbuild is a bundler and transpiler optimized for raw build speed — the right choice for dev environments, library bundling, and as Vite’s internal engine. In practice, framework choice often makes this decision for you. If you’re picking independently, esbuild is faster at bundling; SWC is more feature-complete as a transpiler.
How do I know if V8 is deoptimizing my code?
Two practical methods: (1) node --trace-opt --trace-deopt your-script.js — functions that appear in both logs are yo-yo functions worth investigating. (2) Chrome DevTools Performance tab — record a real interaction, look for flame graph entries marked with a deoptimization marker. For production Node.js services, node --prof and node --prof-process give you a CPU profile you can analyze offline.
Does the React Compiler replace useMemo and useCallback entirely?
Practically, yes — you can stop adding new useMemo and useCallback calls in compiler-enabled codebases. The compiler inserts them where they’re actually needed, which is often different from where humans would intuitively add them. Existing calls in your codebase are either compiled away or preserved where necessary. The compiler does not handle useRef (intentionally) or code it can’t statically analyze.
Is Oxc / oxlint production-ready?
For linting, yes — Shopify’s public migration is the clearest validation. Oxc is in active development as a broader toolchain (parser, transformer, bundler), and the pace of development is high. For linting alone, switching to oxlint is a low-risk, high-reward change on large codebases. For using Oxc as a full compilation pipeline, evaluate it against your specific use case — it’s moving fast but not all components are at the same maturity level.
Does Turbopack replace Webpack for Next.js production builds now?
Yes — Turbopack became stable for Next.js production builds in January 2026. If you’re on a recent Next.js version, it’s available to opt into. The benchmark improvements are real: substantially faster cold builds and faster HMR in development. For existing projects, the migration is mostly a configuration flag, though some Webpack-specific customizations may need to be ported.
How much does the React Compiler slow down my build?
There is a build-time cost — the compiler is doing static analysis work that didn’t happen before. In practice, the overhead is small relative to other build steps for most projects, and it’s one-time work at build time that reduces runtime work (fewer re-renders). The React team has not published specific build time numbers, but community reports suggest it adds seconds, not minutes, to build times on typical codebases. For hot module replacement in dev, the compiler runs incrementally, so per-file latency is low.
I’m on a small project (under 10 components, under 5 minutes build time). How much of this applies?
Very little of the toolchain advice is urgent at that scale. Fix your TypeScript target if it’s still set to ES5 — that’s a free win. Consider React Compiler if you have re-render performance issues. Skip the deep V8 profiling unless you have a specific latency problem to investigate. The gains from SWC vs Babel are real but measured in seconds, which only matters when builds take minutes. Invest the saved time in application code.
Why is TypeScript 7 written in Go and not Rust like SWC and Oxc?
Microsoft chose Go because the TypeScript compiler is being ported, not rewritten. The existing JavaScript codebase has complex shared mutable state and recursive type inference that maps poorly to Rust’s ownership model — porting to Rust would have required rewriting huge chunks of logic, risking subtle behavioral divergence. Go’s simpler model allowed the team to translate existing code more directly, which is how they can run 20,000 test cases and show identical results between tsc and tsgo. The tradeoff is that Go isn’t quite as fast as Rust for this type of workload, but 10× faster than the JavaScript version is still transformative.
Final Verdict
Most JS compiler configurations in the wild are accidental — the result of following a 2021 tutorial, copying a Stack Overflow setup, or bootstrapping with create-react-app and never revisiting it. The ecosystem has moved far enough in the past three years that “set it and forget it” is now actively harmful. Tools that were the right choice in 2022 have been replaced by tools that are dramatically faster, not marginally faster.
The three things that actually matter, in order of impact: (1) V8 shape consistency in hot code paths — the cheapest fix with potentially the highest impact on production latency; (2) toolchain modernization — move to SWC or esbuild if you haven’t, separate emit from type-checking; (3) compiler features — React Compiler if you’re on React 17+, TypeScript 6.0 migration with tsgo side-by-side for forward compatibility. The 60-minute estimate in the title is accurate for teams that profile before touching anything, identify the primary bottleneck, and make one targeted change at a time.
What takes longer is organizational: convincing a risk-averse team that changing the build tool is safe. That’s a different problem, but knowing the exact numbers — 10× build time reduction, 20–30% render latency reduction, 200ms latency spikes explained — makes the conversation substantially easier to have.
More from CodeTalentHub
Engineering depth, hiring guides, and career resources for serious JavaScript developers.
20 Viral Web App Projects That Can Outrank YC Startups in 2026
How to Showcase Your GitHub Project the Right Way
[card url=”https://www.codetalenthub.io/javascript-snippets-explained/”]
[card url=”https://www.codetalenthub.io/python-automation-guide/”]
[card url=”https://www.codetalenthub.io/30-real-python-projects/”]
[card url=”https://www.codetalenthub.io/low-code-vs-no-code-2026/”]
[card url=”https://www.codetalenthub.io/top-7-low-code-platforms-2025-enterprise-guide/”]