

All 69 S&P 500 companies that have raised their dividend every single year for a quarter century — with full data, sector breakdowns, honest performance analysis, and what you actually need to know before buying.
There’s a shortlist of investing filters that genuinely earn their reputation. The Dividend Aristocrats — S&P 500 companies that have raised their dividend every single year for at least 25 consecutive years — is one of them. Not because the label is magic, but because the discipline required to stay on it tends to self-select for businesses that are run properly.
As of the 2025 index rebalancing (which carries through 2026 with no further changes), there are exactly 69 Dividend Aristocrats — a record high since the index launched in 1989. Three new members joined in January 2025: FactSet Research Systems (FDS), Erie Indemnity (ERIE), and Eversource Energy (ES). No companies were removed, which itself is unusual — the first time that’s happened in the index’s history.
Sources: S&P Dow Jones Indices · Sure Dividend · Simply Safe Dividends
What “Dividend Aristocrat” Actually Means
It’s a registered trademark of S&P Global — not a generic category. The S&P 500 Dividend Aristocrats® Index is formally maintained by S&P Dow Jones Indices, reconstituted annually each January. The index is equal-weighted — meaning Procter & Gamble and a smaller industrial name each carry roughly the same 1.4% allocation. That’s a deliberate structural choice, and it has real performance implications we’ll cover later.
The key word people miss: “increased.” Not just paid. Not maintained. Increased the absolute dollar amount per share, every year, without exception. A freeze counts as a miss. If a company keeps its dividend flat for even one year, it’s out. That’s what makes the streak genuinely meaningful.
“A company cannot pay rising dividends for 25+ years without a strong and durable competitive advantage. That’s the filter — not the dividend itself.”
— Ben Reynolds, Sure Dividend Research DatabaseWorth noting: a company’s yield doesn’t need to rise — just the per-share dollar amount. In practice, many Aristocrats have yields that have declined over time because their stock price outpaced dividend growth. Colgate-Palmolive yielded over 3% a decade ago; today it’s closer to 2.3%. That’s not a problem — it’s what happens when a quality business compounds.
The Three Qualification Criteria
Getting onto the Aristocrats list isn’t particularly complicated — but staying on it is. S&P Dow Jones Indices requires three things simultaneously:
1. S&P 500 Membership
The company must be a current S&P 500 constituent. That means a minimum float-adjusted market cap of roughly $13.1 billion as of 2026. This rules out plenty of companies with long dividend histories — including some of the Dividend Kings — simply because they’re too small or too illiquid. American States Water (AWR) has one of the longest streaks of any U.S. company, but it’s a mid-cap utility that doesn’t qualify for Aristocrat status.
2. 25+ Consecutive Years of Annual Dividend Increases
The defining criterion. The company must have raised its per-share dividend amount every single calendar year for at least 25 consecutive years. There’s some nuance with spin-offs: AbbVie inherited Abbott’s streak when it was spun off in 2013, which is how it qualified with fewer than 25 independent years. S&P’s index committee applies discretion here, which has generated some debate among purists.
3. Minimum Liquidity Requirements
Average daily trading volume must meet specific thresholds to ensure sufficient institutional access. This is a largely mechanical filter, but it matters — particularly for smaller companies that have reached the 25-year milestone but can’t handle large institutional flows.
If fewer than 40 companies qualify in a given year, S&P may include companies with slightly shorter growth histories to maintain index viability. This has happened before, though the current 69-member count is comfortably above that threshold.
The Full List of All 69 Dividend Aristocrats (2026)
All companies currently qualifying under the S&P 500 Dividend Aristocrats® Index. Streak years are approximate and based on S&P classifications — companies marked ★ also qualify as Dividend Kings (50+ year streak). Yields as of May 2026, approximate — verify current figures before any investment decision.
| Company | Ticker | Sector | Streak (yrs) | ~Yield |
|---|---|---|---|---|
| Consumer Staples | ||||
| Procter & Gamble ★ | PG | Consumer Staples | ~68 yrs | ~2.5% |
| Coca-Cola ★ | KO | Consumer Staples | ~63 yrs | ~3.2% |
| Colgate-Palmolive ★ | CL | Consumer Staples | ~62 yrs | ~2.3% |
| PepsiCo ★ | PEP | Consumer Staples | ~53 yrs | ~3.5% |
| Sysco ★ | SYY | Consumer Staples | ~55 yrs | ~2.8% |
| Altria Group | MO | Consumer Staples | ~54 yrs | ~7.4% |
| Hormel Foods ★ | HRL | Consumer Staples | ~58 yrs | ~3.6% |
| Kenvue | KVUE | Consumer Staples | ~25 yrs* | ~3.4% |
| Church & Dwight | CHD | Consumer Staples | ~28 yrs | ~1.1% |
| Clorox | CLX | Consumer Staples | ~48 yrs | ~3.1% |
| Walmart | WMT | Consumer Staples | ~51 yrs | ~1.1% |
| McCormick | MKC | Consumer Staples | ~39 yrs | ~2.1% |
| Archer-Daniels-Midland | ADM | Consumer Staples | ~50 yrs | ~4.5% |
| Amcor | AMCR | Consumer Staples | ~25 yrs* | ~6.8% |
| Industrials | ||||
| Dover Corporation ★ | DOV | Industrials | ~71 yrs | ~1.3% |
| Genuine Parts ★ | GPC | Industrials | ~70 yrs | ~3.2% |
| Emerson Electric ★ | EMR | Industrials | ~69 yrs | ~1.9% |
| Parker-Hannifin ★ | PH | Industrials | ~70 yrs | ~1.4% |
| Illinois Tool Works ★ | ITW | Industrials | ~60 yrs | ~2.2% |
| Caterpillar | CAT | Industrials | ~31 yrs | ~1.6% |
| Stanley Black & Decker | SWK | Industrials | ~56 yrs | ~4.0% |
| A.O. Smith | AOS | Industrials | ~30 yrs | ~1.9% |
| Cintas | CTAS | Industrials | ~41 yrs | ~1.0% |
| W.W. Grainger | GWW | Industrials | ~53 yrs | ~0.8% |
| Nordson | NDSN | Industrials | ~60 yrs | ~1.1% |
| Expeditors Intl. | EXPD | Industrials | ~29 yrs | ~1.4% |
| Fastenal | FAST | Industrials | ~25 yrs | ~2.4% |
| Roper Technologies | ROP | Industrials | ~31 yrs | ~0.6% |
| Otis Worldwide | OTIS | Industrials | ~25 yrs* | ~1.6% |
| Healthcare | ||||
| Johnson & Johnson ★ | JNJ | Healthcare | ~63 yrs | ~3.3% |
| Abbott Laboratories ★ | ABT | Healthcare | ~53 yrs | ~1.9% |
| AbbVie | ABBV | Healthcare | ~25 yrs* | ~3.7% |
| Becton Dickinson ★ | BDX | Healthcare | ~54 yrs | ~1.8% |
| Medtronic | MDT | Healthcare | ~47 yrs | ~3.0% |
| West Pharmaceutical Services | WST | Healthcare | ~30 yrs | ~0.4% |
| Financials | ||||
| Aflac | AFL | Financials | ~43 yrs | ~2.3% |
| T. Rowe Price | TROW | Financials | ~38 yrs | ~4.7% |
| S&P Global | SPGI | Financials | ~51 yrs | ~0.8% |
| Automatic Data Processing | ADP | Financials | ~51 yrs | ~2.2% |
| Cincinnati Financial ★ | CINF | Financials | ~65 yrs | ~2.8% |
| Erie Indemnity | ERIE | Financials | ~25 yrs | ~1.3% |
| FactSet Research Systems | FDS | Financials | ~25 yrs | ~1.0% |
| Franklin Resources | BEN | Financials | ~44 yrs | ~6.4% |
| Cboe Global Markets | CBOE | Financials | ~33 yrs | ~1.3% |
| Materials | ||||
| Linde | LIN | Materials | ~31 yrs | ~1.4% |
| Air Products & Chemicals ★ | APD | Materials | ~42 yrs | ~2.4% |
| Nucor | NUE | Materials | ~51 yrs | ~1.8% |
| PPG Industries ★ | PPG | Materials | ~54 yrs | ~2.0% |
| Sherwin-Williams | SHW | Materials | ~45 yrs | ~0.9% |
| Albemarle | ALB | Materials | ~29 yrs | ~2.1% |
| RPM International | RPM | Materials | ~51 yrs | ~1.9% |
| Ecolab | ECL | Materials | ~32 yrs | ~1.1% |
| Consumer Discretionary | ||||
| Lowe’s | LOW | Consumer Disc. | ~62 yrs | ~2.0% |
| McDonald’s | MCD | Consumer Disc. | ~48 yrs | ~2.4% |
| Target | TGT | Consumer Disc. | ~56 yrs | ~4.1% |
| Ross Stores | ROST | Consumer Disc. | ~29 yrs | ~1.3% |
| Real Estate | ||||
| Federal Realty Investment ★ | FRT | Real Estate | ~59 yrs | ~4.3% |
| Realty Income | O | Real Estate | ~30 yrs | ~5.2% |
| Essex Property Trust | ESS | Real Estate | ~30 yrs | ~3.5% |
| Utilities | ||||
| Consolidated Edison ★ | ED | Utilities | ~51 yrs | ~3.5% |
| Eversource Energy | ES | Utilities | ~26 yrs | ~4.7% |
| Atmos Energy | ATO | Utilities | ~40 yrs | ~2.6% |
| Energy | ||||
| Chevron | CVX | Energy | ~37 yrs | ~4.2% |
| ExxonMobil | XOM | Energy | ~42 yrs | ~3.5% |
| Technology | ||||
| IBM | IBM | Technology | ~29 yrs | ~3.2% |
| Automatic Data Processing | ADP | Technology/Fin. | ~51 yrs | ~2.2% |
★ = Also qualifies as a Dividend King (50+ consecutive years). * = Inherited streak via spin-off or acquisition per S&P index committee ruling. Yields are approximate as of May 2026 — always verify on a financial platform before investing. Full index via S&P Dow Jones Indices.
Sector Breakdown — Who Dominates the List
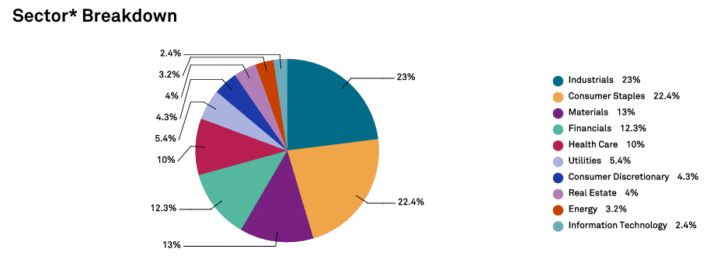
The Aristocrats index looks nothing like the broader S&P 500. The S&P 500 allocates roughly 32% to Information Technology. The Aristocrats index puts about 3% there. If you buy NOBL thinking you’re getting broad market exposure, you’re in for a surprise.
Industrials
~15 ~22% of indexConsumer Staples
~14 ~20% of indexFinancials
~9 ~13% of indexHealthcare
~6 ~9% of indexMaterials
~8 ~12% of indexConsumer Disc.
~4 ~6% of indexUtilities
~4 ~6% of indexReal Estate
~3 ~4% of indexEnergy
2 ~3% of indexTechnology
2 ~3% of indexSource: S&P Dow Jones Indices, Simply Safe Dividends, InvestSnips
The underweight to technology is the single biggest structural story for Aristocrat performance in recent years. When the S&P 500 is being driven by Apple, Nvidia, and Microsoft, a portfolio sitting at 3% tech allocation will trail — predictably, mechanically, and without any particular fault in the underlying businesses.
That’s not a bug. That’s the design. The Aristocrats index was never built to capture mega-cap growth. It was built to give investors stability, income, and downside protection. Over long periods, it has generally done that job well. But the last five years have tested the patience of anyone benchmarking against the Nasdaq or the S&P 500.
Performance: What the Data Actually Shows
Let’s go through the real numbers, because the narrative around Aristocrat performance is more complicated than most promotional materials suggest.
The ProShares NOBL ETF — The Cleanest Proxy
The only ETF that exclusively tracks the official Dividend Aristocrats index is the ProShares S&P 500 Dividend Aristocrats ETF (NOBL), launched October 9, 2013. Expense ratio: 0.35%.
| Period | NOBL Total Return | S&P 500 Total Return | Delta |
|---|---|---|---|
| 2024 | +6.71% | +25.02% | −18.3pp |
| 2023 | +8.09% | +26.3% | −18.2pp |
| 2022 | −6.52% | −18.1% | +11.6pp |
| 2021 | +25.49% | +28.7% | −3.2pp |
| 2020 | +8.32% | +18.4% | −10.1pp |
| 5-Year CAGR (to Dec 2024) | +7.94% | +14.51% | −6.6pp/yr |
| 10-Year CAGR (to Dec 2024) | +9.39% | +13.09% | −3.7pp/yr |
| Since Inception CAGR (Oct 2013) | +10.15% | +13%~ | −2.9pp/yr |
Source: ProShares NOBL Prospectus (Sep 2025) · PortfoliosLab · FinanceCharts
The gap versus the S&P 500 over the last decade is largely a tech story. The S&P 500 has increasingly become a quasi-technology index — Apple, Microsoft, Nvidia, Amazon, and Meta now make up over 25% of its weight. The Aristocrats index has virtually none of that exposure. That’s a real trade-off worth understanding before investing.
Where They Shine: Downside Protection
The honest case for Aristocrats isn’t that they beat the market — it’s that they protect capital better during downturns. The data on this is fairly consistent:
2008 Financial Crisis
During the global financial crisis, the S&P 500 Dividend Aristocrats Index fell approximately 21.88% compared to the S&P 500’s 37% decline — a gap of roughly 15 percentage points. That’s meaningful cushioning. For a $500,000 portfolio, the difference between losing 22% and losing 37% is about $75,000 in preserved capital.
Beyond just falling less, the recovery was faster too. The Aristocrats index returned to pre-crash price levels within roughly two years. The S&P 500 took closer to four.
Source: Longbridge Capital / S&P Dow Jones Indices (March 2025)
From December 1989 to February 2025, the maximum drawdown for the Dividend Aristocrats Index was about −44.1%, compared to −50.9% for the S&P 500, according to S&P Dow Jones Indices data. Since 1990, the Aristocrats index has outperformed the S&P 500 in every year the broader market posted a negative total return.
In 2022 — when rising interest rates hammered growth stocks — the S&P 500 fell about 18%. NOBL was down just 6.5%. That kind of relative outperformance in bad years is exactly what the index was designed to deliver.
“Since the beginning of 1990, owning S&P 500 components with at least a 25-year history of growing their dividends has outperformed the broad S&P 500 by 1.78% per year.”
— Ploutos, Institutional CFA / Seeking Alpha, citing Bloomberg data (2020)Dividend Kings vs. Aristocrats: The Tiers Explained
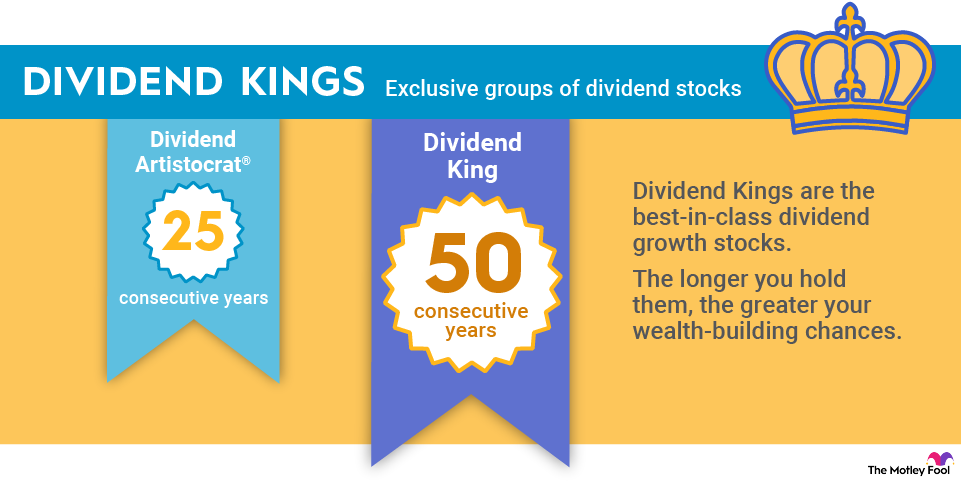
Dividend Kings require 50+ consecutive years of dividend increases — double the Aristocrat threshold. There’s no S&P 500 membership requirement, which means some Kings are mid-cap companies that aren’t in the Aristocrats index at all.
| Feature | Dividend Aristocrats | Dividend Kings |
|---|---|---|
| Minimum Streak Required | 25 consecutive years | 50 consecutive years |
| S&P 500 Membership Required? | Yes | No |
| Approximate Count (2026) | 69 companies | ~57 companies |
| Formal Index? | Yes — S&P Dow Jones Indices | No — informal designation |
| ETF Available? | Yes — NOBL (ProShares) | No dedicated ETF |
| Includes Small/Mid-Cap? | No | Yes |
Companies that belong to both lists — sometimes called the “elite within the elite” — include Procter & Gamble (70+ years), Genuine Parts (70+ years), Dover Corporation (71 years), Coca-Cola (63+ years), Johnson & Johnson (63+ years), Colgate-Palmolive (62+ years), and Emerson Electric (69+ years). These are genuinely remarkable businesses — every one of them has paid rising dividends through the Cold War, the stagflation era, the dot-com crash, 9/11, the 2008 financial crisis, a global pandemic, and a period of 40-year-high inflation.
Real Risks: What Can Go Wrong
The Aristocrats list isn’t a guarantee of anything. The discipline required to build a 25-year streak doesn’t prevent business model disruption, and a long history is backward-looking by definition. Several high-profile removals make this point clearly.
Recent Removals — Streaks That Ended
3M (MMM) — Removed 2024
3M had raised its dividend for over 65 consecutive years — one of the longest streaks in corporate history. When it spun off its healthcare division as Solventum in 2024, the restructuring broke the consecutive-increase streak under S&P’s methodology. 3M the parent company actually reduced its dividend as part of the transaction. After 65 years on the list, it was gone in a single quarter. The lesson: corporate actions — spin-offs, mergers, major restructurings — can break even the most impressive streaks instantly.
Walgreens (WBA) — Removed 2024
Walgreens had been a Dividend Aristocrat for decades, but years of deteriorating pharmacy economics, margin pressure, and operational missteps finally caught up with it. The company cut its dividend in early 2024 after years of warnings visible in payout ratio analysis. It’s a reminder that a long streak can mask declining fundamentals if investors stop looking at the underlying business.
VF Corporation (VFC) — Removed 2023
VFC held Aristocrat status for over 50 years before cutting its dividend in late 2022/2023 amid a debt-heavy balance sheet, declining brand performance (particularly Timberland and Vans), and cash flow pressure. Despite its extraordinary streak length, the business deteriorated relatively quickly once competitive dynamics shifted. VFC is now a cautionary tale about using streak length as a substitute for fundamental research.
Before buying any Aristocrat purely for the streak, check: payout ratio relative to sector peers, free cash flow coverage of the dividend, debt-to-EBITDA trends, and whether the business model faces structural headwinds. A 40-year streak doesn’t insulate a company from industry disruption.
The Tech Underweight Risk
If artificial intelligence and technology continue to dominate equity returns over the next decade as they have over the last, the Aristocrats index will likely continue to lag. That’s not a catastrophic outcome — earning 9–10% annually in a quality, lower-volatility portfolio is still excellent. But investors expecting the Aristocrats to be a market-beating strategy in all environments will be disappointed during sustained tech bull markets.
Interest Rate Sensitivity
Dividend-paying stocks generally face headwinds when interest rates rise, because higher bond yields compete directly with dividend income for income-seeking investors. The 2022 rate-hiking cycle hit utilities, REITs, and slower-growth Aristocrats particularly hard. Eversource Energy’s stock fell significantly in 2022-2023 even as it kept raising its dividend — which is precisely how it got onto the Aristocrats list just as the yield became attractive enough to qualify for investor attention.
How to Invest in Dividend Aristocrats
Option A: Buy the ETF (NOBL)
The simplest path. NOBL is the only ETF that exclusively tracks the official S&P 500 Dividend Aristocrats Index. It holds all 69 current members at equal weight (~1.4% each), rebalanced quarterly. Expense ratio is 0.35% — reasonable but not dirt-cheap. For investors who want instant diversification without stock-picking, this is the cleanest solution.
Key detail: because it’s equal-weighted, NOBL gives you just as much exposure to a $15 billion industrial company as to Procter & Gamble. That’s different from how most investors think about large-cap investing, and it has real implications for sector tilts and factor exposure.
Option B: Build an Individual Stock Portfolio
Buying individual Aristocrats lets you overweight names you have high conviction in, customize your yield target, exclude companies you’re uncomfortable with, and potentially outperform the index by being selective. The downside is concentration risk and the ongoing research burden. Keeping tabs on 10–15 individual companies is meaningful work.
A practical approach for income-focused individual stock investors: start with 3–5 names from different sectors, enable dividend reinvestment (DRIP), and expand over time as you learn each business. Positions in companies like Procter & Gamble, Johnson & Johnson, and Coca-Cola are genuinely boring in the best possible way — they require minimal monitoring and tend to behave as expected.
Yield vs. Growth: An Important Trade-Off
Not all Aristocrats are equal income generators. There’s a consistent pattern: lower-yielding Aristocrats tend to grow dividends faster, and higher-yielding ones provide more current income but with slower growth. This matters more than most investors realize.
| Company | Current Yield | ~10yr Dividend Growth Rate | Type |
|---|---|---|---|
| Lowe’s (LOW) | ~2.0% | ~17%/yr | Growth-oriented |
| Automatic Data Processing (ADP) | ~2.2% | ~11%/yr | Growth-oriented |
| Cintas (CTAS) | ~1.0% | ~20%/yr | Growth-oriented |
| Procter & Gamble (PG) | ~2.5% | ~5%/yr | Balanced |
| Altria (MO) | ~7.4% | ~4%/yr | High-yield / slower growth |
| Realty Income (O) | ~5.2% | ~4%/yr | High-yield / moderate growth |
| T. Rowe Price (TROW) | ~4.7% | ~13%/yr (hist.) | High-yield |
The math here is worth internalizing. An Aristocrat yielding 1% with 15% annual dividend growth will surpass the income of a 5%-yielder growing at 3% within roughly 13 years. For investors with a long time horizon, growth-oriented Aristocrats often generate more total income over 20–30 years than the highest-yielding names on the list today.
Building a Practical Aristocrat Strategy
For Income-Focused Investors (Retirees, Near-Retirees)
A diversified sleeve of 8–12 Aristocrats weighted toward the 3%–5%+ yielding names — Realty Income, Chevron, Federal Realty, Eversource, T. Rowe Price — can generate a portfolio yield of 3–4% while still delivering annual income growth. The income grows every year without requiring you to sell shares, which is psychologically useful in volatile markets.
Tax-advantaged accounts (IRAs, 401(k)s) are ideal for dividend stocks because dividends are taxed annually in taxable accounts. Most Aristocrat dividends qualify as “qualified dividends” taxed at preferential capital gains rates (0%, 15%, or 20%), but sheltering the reinvestment inside an IRA compounds the tax advantage significantly over decades.
For Long-Term Accumulators (Under 50)
The growth-oriented Aristocrats — Cintas, Lowe’s, ADP, Sherwin-Williams, Fastenal — often yield under 2% today but compound at rates that dwarf the higher-yielders over 20+ years. Combined with DRIP (dividend reinvestment plan), these names can build substantial positions with very little active management.
The equal-weighted NOBL ETF is genuinely underrated for younger investors who don’t want to research individual stocks. At 0.35% annually, it provides instant diversification across 69 quality companies with the discipline of equal weighting built in.
Portfolio Sizing Guidance
A 15–25% sleeve allocation to Dividend Aristocrats works well inside a broader portfolio — enough to provide meaningful income and downside cushion without so much concentration in defensive sectors that you give up growth entirely in bull markets. Spread across 6–10 names from different sectors, rebalance annually, and reinvest dividends in the early accumulation phase.
What to Watch in 2026
The January 2026 rebalancing brought no changes — the first time in recorded history. For 2027, the most likely new addition is Southern Company (SO), the regulated utility that is on track to hit 25 consecutive years of dividend increases. Several industrial and financial names are also within striking distance of the 25-year threshold.
On the risk side, a handful of current Aristocrats bear watching for payout sustainability — particularly those in sectors facing structural headwinds. The lesson from VFC, Walgreens, and 3M is that even a 50-year streak tells you about the past, not the future.
The broader context matters too. If interest rates normalize downward from their 2022–2025 highs, income-oriented strategies including the Aristocrats tend to see re-rating tailwinds. Conversely, a prolonged AI-driven growth market that concentrates returns in tech would continue to make the Aristocrats lag the S&P 500 headline number.
Neither scenario invalidates the core proposition: for investors who want consistent, growing income, lower volatility than the market, and a quality filter that’s stood up through multiple economic cycles — the Dividend Aristocrats remain one of the more honest and well-designed labels in investing.
All data sourced from S&P Dow Jones Indices, ProShares, Simply Safe Dividends, Sure Dividend, and company filings. Yields and streak data are approximate as of May 2026 and subject to change. This article is for informational purposes only and does not constitute financial advice. Always conduct your own research before making investment decisions.
More from Trendix.tech
Deep-dive guides on investing, markets, and building long-term wealth.
Passive Income Ideas 2026
Passive Income Tier List for 2026
What’s the Best Passive Income to Invest In? Strategies That Actually Work (Ranked by Results)
[card url=”https://www.codetalenthub.io/7-passive-income-for-developers/”]
[card url=”https://www.codetalenthub.io/simple-coding-projects-for-passive-income/”]
[card url=”https://www.codetalenthub.io/generalist-freelancers/”]
[card url=”https://www.codetalenthub.io/top-niche-freelance-sites-for-coders/”]
[card url=”https://www.codetalenthub.io/5-tech-resume-phrases-for-2025/”]